desc.plotting.plot_comparison
- desc.plotting.plot_comparison(eqs, rho=8, theta=8, phi=None, ax=None, cmap='rainbow', color=None, lw=None, ls=None, labels=None, return_data=False, **kwargs)Source
Plot comparison between flux surfaces of multiple equilibria.
NOTE: If attempting to plot objects with differing NFP, phi must be given explicitly.
- Parameters:
eqs (array-like of Equilibrium or EquilibriaFamily) – Equilibria to compare.
rho (int or array-like) – Values of rho to plot contours of. If an integer, plot that many contours linearly spaced in (0,1).
theta (int or array-like) – Values of theta to plot contours of. If an integer, plot that many contours linearly spaced in (0,2pi).
phi (float, int or array-like or None) – Values of phi to plot contours at. If an integer, plot that many contours linearly spaced in [0,2pi). Default is 1 contour for axisymmetric equilibria or 6 for non-axisymmetry.
ax (matplotlib AxesSubplot, optional) – Axis to plot on.
cmap (str or matplotlib ColorMap) – Colormap to use for plotting, discretized into len(eqs) colors.
color (array-like) – Array the same length as eqs of colors to use for each equilibrium. Overrides cmap.
lw (array-like) – Array the same length as eqs of line widths to use for each equilibrium
ls (array-like) – Array the same length as eqs of linestyles to use for each equilibrium.
labels (array-like) – Array the same length as eqs of labels to apply to each equilibrium.
return_data (bool) – If True, return the data plotted as well as fig,ax
**kwargs (dict, optional) –
Specify properties of the figure, axis, and plot appearance e.g.:
plot_X(figsize=(4,6),label="your_label")
Valid keyword arguments are:
figsize: tuple of length 2, the size of the figure (to be passed to matplotlib)legend: bool, whether to display legend or notlegend_kw: dict, any keyword arguments to be passed to ax.legend()title_fontsize: integer, font size of the titlexlabel_fontsize: float, fontsize of the xlabelylabel_fontsize: float, fontsize of the ylabel
- Returns:
fig (matplotlib.figure.Figure) – Figure being plotted to.
ax (matplotlib.axes.Axes or ndarray of Axes) – Axes being plotted to.
plot_data (dict) – Dictionary of the data plotted, only returned if
return_data=True
Examples
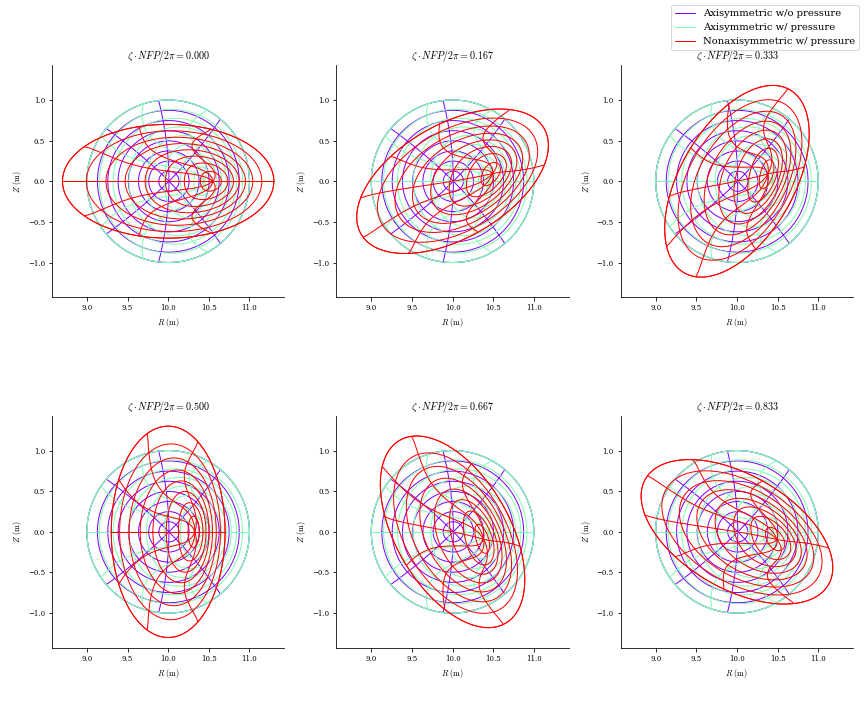
from desc.plotting import plot_comparison
fig, ax = plot_comparison(eqs=[eqf[0],eqf[1],eqf[2]],
                          labels=['Axisymmetric w/o pressure',
                                  'Axisymmetric w/ pressure',
                                  'Non-axisymmetric w/ pressure',
                                 ],
                         )