desc.plotting.plot_surfaces
- desc.plotting.plot_surfaces(eq, rho=8, theta=8, phi=None, ax=None, return_data=False, **kwargs)Source
Plot flux surfaces.
- Parameters:
eq (Equilibrium) – Object from which to plot.
rho (int or array-like) – Values of rho to plot contours of. If an integer, plot that many contours linearly spaced in (0,1).
theta (int or array-like) – Values of theta to plot contours of. If an integer, plot that many contours linearly spaced in (0,2pi).
phi (float, int or array-like or None) – Values of phi to plot contours at. If an integer, plot that many contours linearly spaced in (0,2pi). Default is 1 contour for axisymmetric equilibria or 6 for non-axisymmetry.
ax (matplotlib AxesSubplot, optional) – Axis to plot on.
return_data (bool) – If True, return the data plotted as well as fig,ax
**kwargs (dict, optional) –
Specify properties of the figure, axis, and plot appearance e.g.:
plot_X(figsize=(4,6),label="your_label")
Valid keyword arguments are:
figsize: tuple of length 2, the size of the figure (to be passed to matplotlib)NR: int, number of equispaced rho point to use in plotting the vartheta contoursNT: int, number of equispaced theta points to use in plotting the rho contourstheta_color: str or tuple, color to use for constant vartheta contourstheta_ls: str, linestyle to use for constant vartheta contourstheta_lw: float, linewidth to use for constant vartheta contoursrho_color: str or tuple, color to use for constant rho contoursrho_ls: str, linestyle to use for constant rho contoursrho_lw: float, linewidth to use for constant rho contourslcfs_color: str or tuple, color to use for the LCFS constant rho contourlcfs_ls: str, linestyle to use for the LCFS constant rho contourlcfs_lw: float, linewidth to use for the LCFS constant rho contouraxis_color: str or tuple, color to use for the axis plotted pointaxis_alpha: float, transparency of the axis plotted pointaxis_marker: str, markerstyle to use for the axis plotted pointaxis_size: float, markersize to use for the axis plotted pointtitle_fontsize: integer, font size of the titlexlabel_fontsize: float, fontsize of the xlabelylabel_fontsize: float, fontsize of the ylabellabel: str, label of the plotted line (e.g. to be shown with ax.legend())legend: bool, whether to show legend or not, False by default
- Returns:
fig (matplotlib.figure.Figure) – Figure being plotted to.
ax (matplotlib.axes.Axes or ndarray of Axes) – Axes being plotted to.
plot_data (dict) – Dictionary of the data plotted, only returned if
return_data=True
Examples
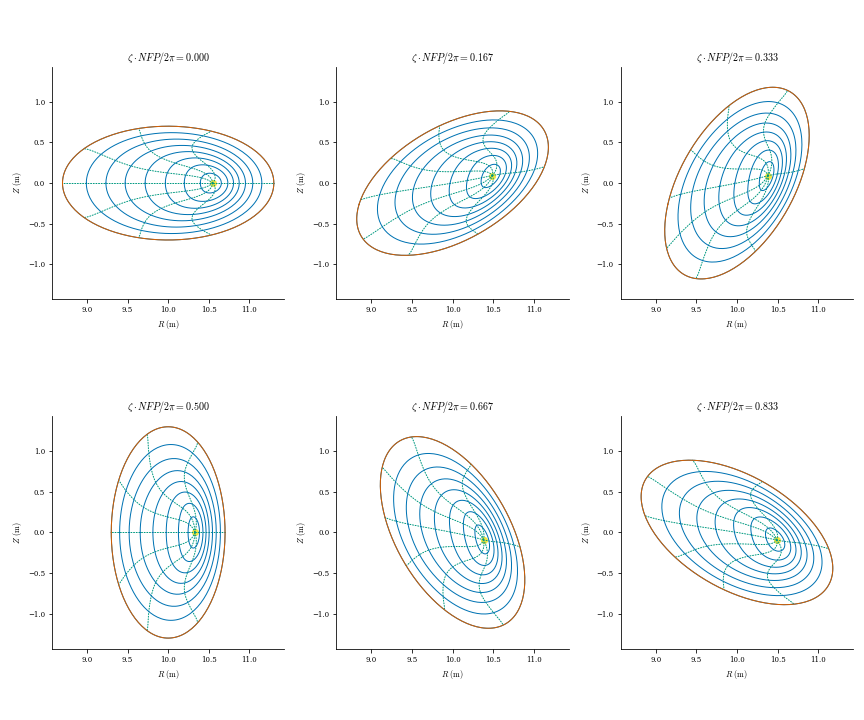
from desc.plotting import plot_surfaces
fig, ax = plot_surfaces(eq)