desc.plotting.plot_qs_error
- desc.plotting.plot_qs_error(eq, log=True, fB=True, fC=True, fT=True, helicity=(1, 0), rho=None, ax=None, return_data=False, **kwargs)Source
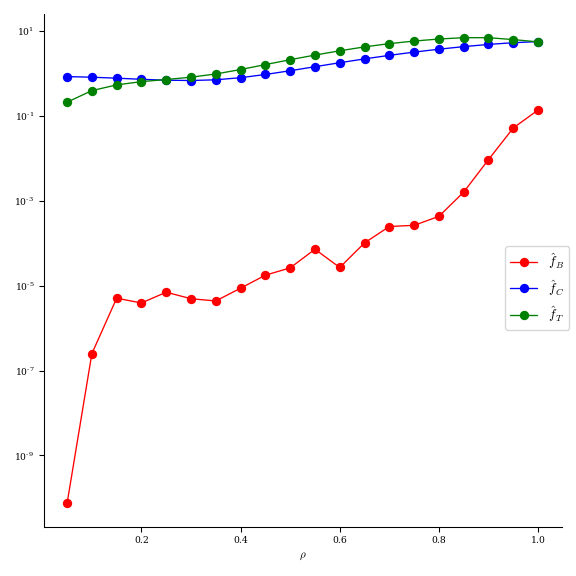
Plot quasi-symmetry errors f_B, f_C, and f_T as normalized flux functions.
- Parameters:
eq (Equilibrium) – Object from which to plot.
log (bool, optional) – Whether to use a log scale.
fB (bool, optional) – Whether to include the Boozer coordinates QS error.
fC (bool, optional) – Whether to include the flux function QS error.
fT (bool, optional) – Whether to include the triple product QS error.
helicity (tuple, int) – Type of quasi-symmetry (M, N).
rho (int or ndarray, optional) – Radial coordinates of the flux surfaces to evaluate at, or number of surfaces in (0,1]
ax (matplotlib AxesSubplot, optional) – Axis to plot on.
return_data (bool) – If True, return the data plotted as well as fig,ax
**kwargs (dict, optional) –
Specify properties of the figure, axis, and plot appearance e.g.:
plot_X(figsize=(4,6))
Valid keyword arguments are:
figsize: tuple of length 2, the size of the figure (to be passed to matplotlib)ls: list of strs of length 3, linestyles to use for the 3 different qs metricslw: list of float of length 3, linewidths to use for the 3 different qs metricscolor: list of strs of length 3, colors to use for the 3 different qs metricsmarker: list of strs of length 3, markers to use for the 3 different qs metricslabels: list of strs of length 3, labels to use for the 3 different qs metricsylabel: str, ylabel to use for plotlegend: bool, whether to display legend or notlegend_kw: dict, any keyword arguments to be passed to ax.legend()xlabel_fontsize: float, fontsize of the xlabelylabel_fontsize: float, fontsize of the ylabel
- Returns:
fig (matplotlib.figure.Figure) – Figure being plotted to.
ax (matplotlib.axes.Axes or ndarray of Axes) – Axes being plotted to.
plot_data (dict) – Dictionary of the data plotted, only returned if
return_data=True
Examples
from desc.plotting import plot_qs_error
fig, ax = plot_qs_error(eq, helicity=(1, eq.NFP), log=True)