desc.plotting.plot_coefficients
- desc.plotting.plot_coefficients(eq, L=True, M=True, N=True, ax=None, **kwargs)Source
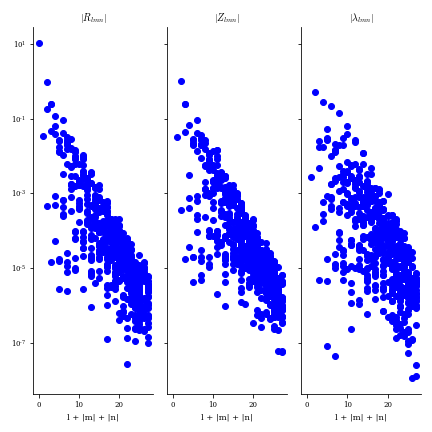
Plot spectral coefficient magnitudes vs spectral mode number.
- Parameters:
eq (Equilibrium) – Object from which to plot.
L (bool) – Whether to include radial mode numbers in the x-axis or not.
M (bool) – Whether to include poloidal mode numbers in the x-axis or not.
N (bool) – Whether to include toroidal mode numbers in the x-axis or not.
ax (matplotlib AxesSubplot, optional) – Axis to plot on.
**kwargs (fig,ax and plotting properties) –
Specify properties of the figure, axis, and plot appearance e.g.:
plot_X(figsize=(4,6))
Valid keyword arguments are:
figsize: tuple of length 2, the size of the figure (to be passed to matplotlib) title_fontsize: integer, font size of the title xlabel_fontsize: integer, font size of the x axis label color: str or tuple, color to use for scatter plot marker: str, marker to use for scatter plot
- Returns:
fig (matplotlib.figure.Figure) – Figure being plotted to.
ax (matplotlib.axes.Axes or ndarray of Axes) – Axes being plotted to.
Examples
from desc.plotting import plot_coefficients
fig, ax = plot_coefficients(eq)