desc.plotting.plot_boozer_modes
- desc.plotting.plot_boozer_modes(eq, log=True, B0=True, norm=False, num_modes=10, rho=None, ax=None, return_data=False, **kwargs)[source]
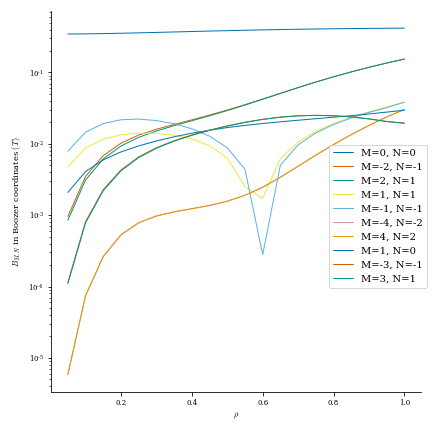
Plot Fourier harmonics of \(|B|\) in Boozer coordinates.
- Parameters:
eq (Equilibrium) – Object from which to plot.
log (bool, optional) – Whether to use a log scale.
B0 (bool, optional) – Whether to include the m=n=0 mode.
norm (bool, optional) – Whether to normalize the magnitudes such that B0=1 Tesla.
num_modes (int, optional) – How many modes to include. Default (-1) is all.
rho (int or ndarray, optional) – Radial coordinates of the flux surfaces to evaluate at, or number of surfaces in (0,1]
ax (matplotlib AxesSubplot, optional) – Axis to plot on.
return_data (bool) – if True, return the data plotted as well as fig,ax
**kwargs (fig,ax and plotting properties) –
Specify properties of the figure, axis, and plot appearance e.g.:
plot_X(figsize=(4,6))
Valid keyword arguments are:
figsize: tuple of length 2, the size of the figure (to be passed to matplotlib) linewidth: float, linewidth linestyle: str, linestyle
- Returns:
fig (matplotlib.figure.Figure) – Figure being plotted to.
ax (matplotlib.axes.Axes or ndarray of Axes) – Axes being plotted to.
plot_data (dict) – dictionary of the data plotted only returned if return_data=True plot_data keys:
- ”B_mn”: |B| harmonic in boozer angles, shape [num_rho,num_modes]
where first index corresponds to the rho surface and second to the modes in B_modes
”B_modes”: array of modes corresponding to B_mn, given as (0,m,n) “rho”
Examples
from desc.plotting import plot_boozer_modes
fig, ax = plot_boozer_modes(eq)