desc.plotting.plot_grid
- desc.plotting.plot_grid(grid, return_data=False, **kwargs)Source
Plot the location of collocation nodes on the zeta=0 plane.
- Parameters:
grid (Grid) – Grid to plot.
return_data (bool) – If True, return the data plotted as well as fig,ax
**kwargs (dict, optional) –
Specify properties of the figure, axis, and plot appearance e.g.:
plot_X(figsize=(4,6))
Valid keyword arguments are:
figsize: tuple of length 2, the size of the figure (to be passed to matplotlib)title_fontsize: integer, font size of the title
- Returns:
fig (matplotlib.figure.Figure) – Figure being plotted to.
ax (matplotlib.axes.Axes or ndarray of Axes) – Axes being plotted to.
plot_data (dict) – Dictionary of the data plotted, only returned if
return_data=True
Examples
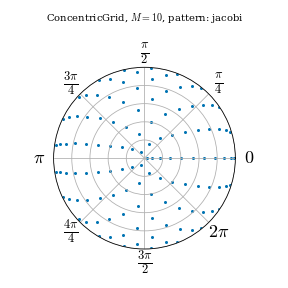
from desc.plotting import plot_grid
from desc.grid import ConcentricGrid
grid = ConcentricGrid(L=20, M=10, N=1, node_pattern="jacobi")
fig, ax = plot_grid(grid)