desc.plotting.plot_3d
- desc.plotting.plot_3d(eq, name, grid=None, log=False, all_field_periods=True, ax=None, return_data=False, **kwargs)Source
Plot 3D surfaces.
- Parameters:
eq (Equilibrium) – Object from which to plot.
name (str) – Name of variable to plot.
grid (Grid, optional) – Grid of coordinates to plot at.
log (bool, optional) – Whether to use a log scale.
all_field_periods (bool, optional) – Whether to plot full torus or one field period. Ignored if grid is specified.
ax (matplotlib AxesSubplot, optional) – Axis to plot on.
return_data (bool) – if True, return the data plotted as well as fig,ax
**kwargs (dict, optional) –
Specify properties of the figure, axis, and plot appearance e.g.:
plot_X(figsize=(4,6),cmap="plasma")
Valid keyword arguments are:
figsize: tuple of length 2, the size of the figure (to be passed to matplotlib)component: str, one of [None, ‘R’, ‘phi’, ‘Z’], For vector variables, which element to plot. Default is the norm of the vector.title_fontsize: integer, font size of the titlexlabel_fontsize: float, fontsize of the xlabelylabel_fontsize: float, fontsize of the ylabelzlabel_fontsize: float, fontsize of the zlabelalpha: float in [0,1.0], the transparency of the plotted surfaceelev: float, elevation orientation angle of 3D plot (in the z plane)azim: float, azimuthal orientation angle of 3D plot (in the x,y plane)dist: float, distance from the camera to the center point of the plot
- Returns:
fig (matplotlib.figure.Figure) – Figure being plotted to.
ax (matplotlib.axes.Axes or ndarray of Axes) – Axes being plotted to.
plot_data (dict) – dictionary of the data plotted, only returned if
return_data=True
Examples
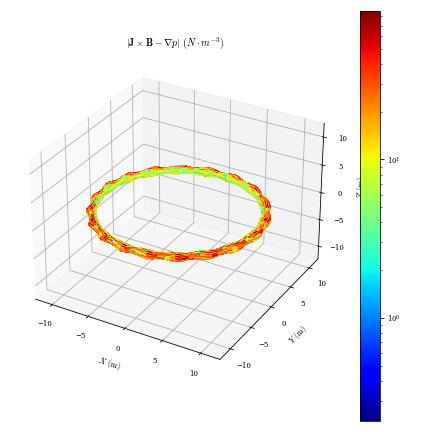
from desc.plotting import plot_3d
from desc.grid import LinearGrid
grid = LinearGrid(
        rho=0.5,
        theta=np.linspace(0, 2 * np.pi, 100),
        zeta=np.linspace(0, 2 * np.pi, 100),
        axis=True,
    )
fig, ax = plot_3d(eq, "|F|", log=True, grid=grid)